The Community Statistics Dashboard team identified the information on this page as helpful to the community and organized it so that the website team could provide it directly to the EmpowerUP audience. This team, in the Spring 2024 Team Dynamics and Decision Making Course at Michigan Tech, consisted of members Marguerite Goldman, Robbie Haslam, Ben Wood, Noah Jukuri, Logan Geissler, and Nik Butcher.
This resource breaks down some components of the workforce in the Upper Peninsula and Michigan.
This dataset provides information regarding the Western Upper Peninsula’s population college enrollment, education level, and completions.
MI School Data – College Degrees and Certificates Awarded: This report provides counts of undergraduate and graduate certificates and degrees granted by Michigan colleges and universities for each academic year (July 1 – June 30). The data is detailed by degree level, program, age, race/ethnicity, gender, and Pell Grant eligibility
https://www.mischooldata.org/college-degrees-and-certificates-awarded/
MI School Data – College Degrees and Certificates Awarded: This report provides counts of undergraduate and graduate certificates and degrees granted by Michigan colleges and universities for each academic year (July 1 – June 30). The data is detailed by degree level, program, age, race/ethnicity, gender, and Pell Grant eligibility.
https://www.mischooldata.org/college-degrees-and-certificates-awarded/
These datasets show a breakdown of the different types of healthcare used by insured and uninsured people within certain age groups.
These data points give an outline of the employment rates and diversity across the Upper Peninsula as well as the state of Michigan.
This resource highlights different family structures such as household makeup and marital status within the Upper Peninsula
These resources outline key mental and physical health factors that affect Americans.
Percentage of six or more workdays missed due to health in the past 12 months for adults aged 18 and over, United States, Jan-Jun, 2019 – Jan-Jun, 2023
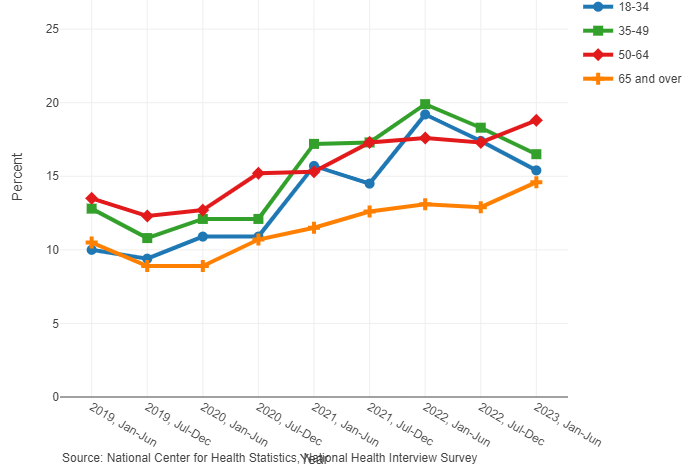
National Center for Health Statistics. Percentage of six or more workdays missed due to health in the past 12 months for adults aged 18 and over, United States, 2019, Jan-Jun—2023, Jan-Jun. National Health Interview Survey. Generated interactively: Mar 31 2024 from https://wwwn.cdc.gov/NHISDataQueryTool/SHS_adult/index.html
Percentage of current cigarette smoking for adults aged 18 and over, United States, Jan-Jun, 2019 – Jan-Jun, 2023
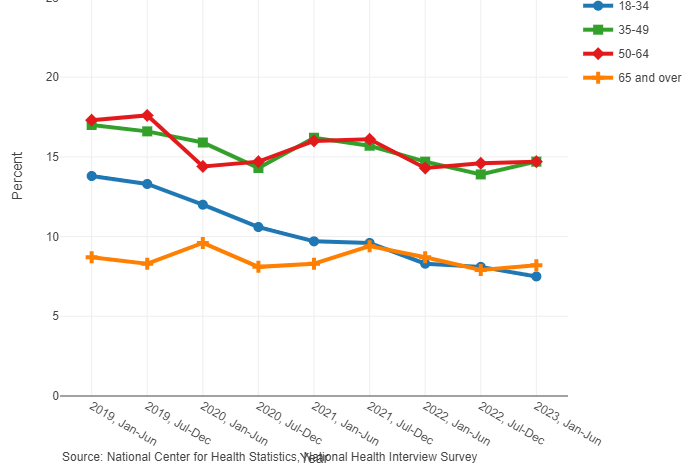
National Center for Health Statistics. Percentage of current cigarette smoking for adults aged 18 and over, United States, 2019, Jan-Jun—2023, Jan-Jun. National Health Interview Survey. Generated interactively: Mar 31 2024 from https://wwwn.cdc.gov/NHISDataQueryTool/SHS_adult/index.html
Percentage of current electronic cigarette use for adults aged 18 and over, United States, Jan-Jun, 2019 – Jan-Jun, 2023
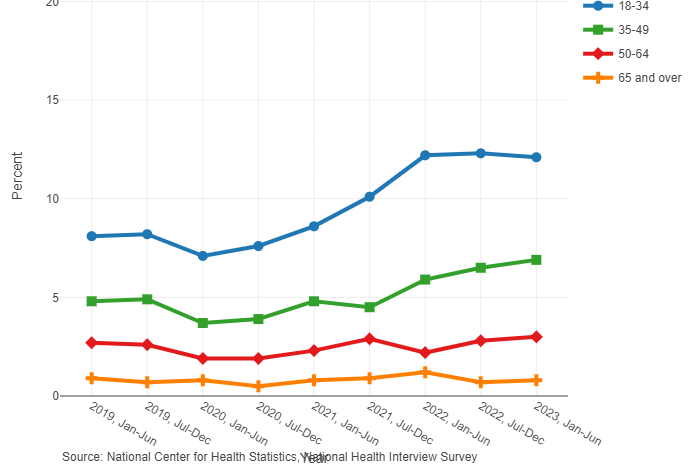
National Center for Health Statistics. Percentage of current electronic cigarette use for adults aged 18 and over, United States, 2019, Jan-Jun—2023, Jan-Jun. National Health Interview Survey. Generated interactively: Mar 31 2024 from https://wwwn.cdc.gov/NHISDataQueryTool/SHS_adult/index.html
Percentage of disability status for adults aged 18 and over, United States, Jan-Jun, 2019 – Jan-Jun, 2023
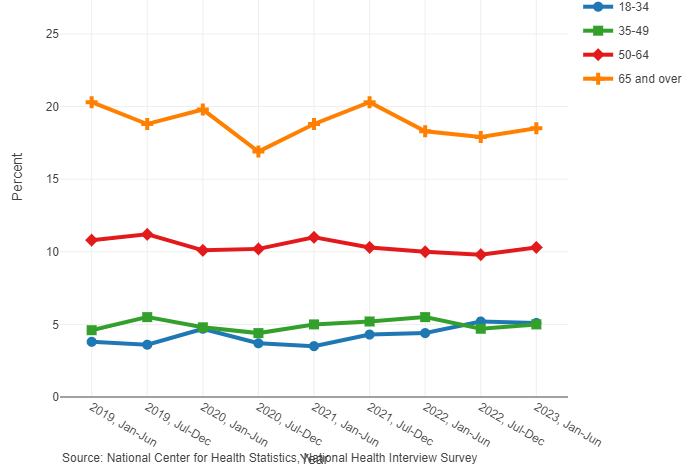
National Center for Health Statistics. Percentage of disability status for adults aged 18 and over, United States, 2019, Jan-Jun—2023, Jan-Jun. National Health Interview Survey. Generated interactively: Mar 31 2024 from https://wwwn.cdc.gov/NHISDataQueryTool/SHS_adult/index.html
Percentage of Mental Health counseling in the past 12 months for adults aged 18 and over, United States, Jan-Jun, 2019 – Jan-Jun, 2023
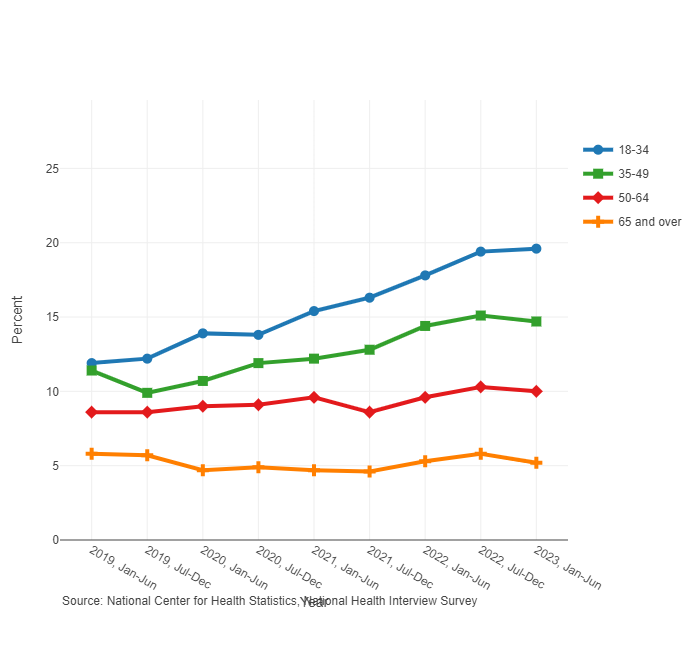
National Center for Health Statistics. Percentage of mental health counseling in the past 12 months for adults aged 18 and over, United States, 2019, Jan-Jun—2023, Jan-Jun. National Health Interview Survey. Generated interactively: Mar 30 2024 from https://wwwn.cdc.gov/NHISDataQueryTool/SHS_adult/index.html
Percentage of regularly had feelings of worry, nervousness, or anxiety for adults aged 18 and over, United States, Jan-Jun, 2019 – Jan-Jun, 2023
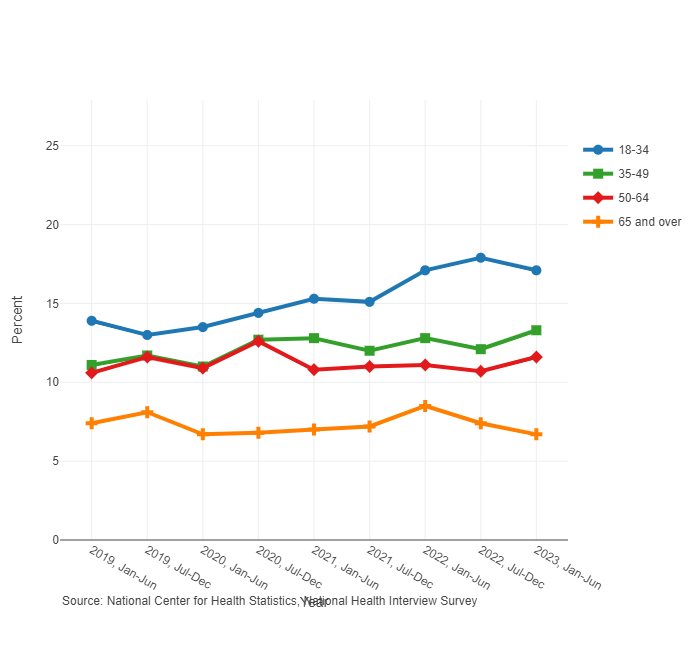
National Center for Health Statistics. Percentage of regularly had feelings of worry, nervousness, or anxiety for adults aged 18 and over, United States, 2019, Jan-Jun—2023, Jan-Jun. National Health Interview Survey. Generated interactively: Mar 30 2024 from https://wwwn.cdc.gov/NHISDataQueryTool/SHS_adult/index.html
Percentage of regularly had feelings of depression for adults aged 18 and over, United States,
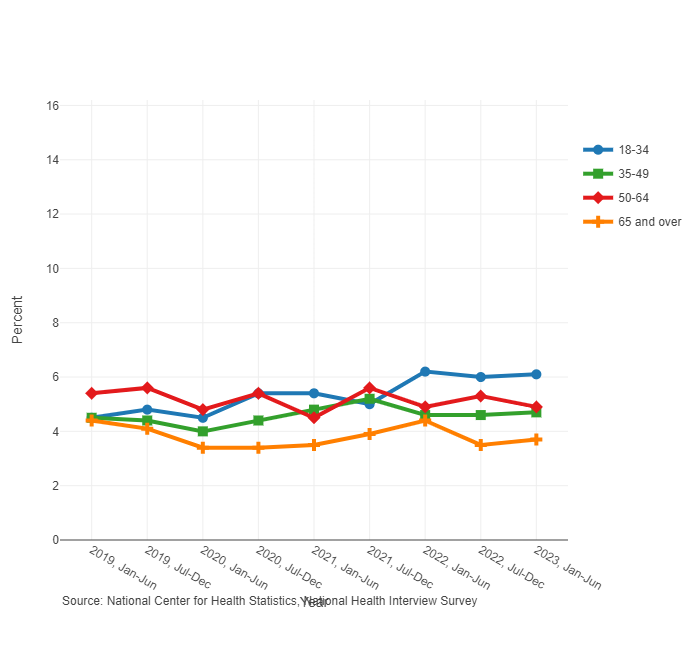
National Center for Health Statistics. Percentage of regularly had feelings of depression for adults aged 18 and over, United States, 2019, Jan-Jun—2023, Jan-Jun. National Health Interview Survey. Generated interactively: Mar 30 2024 from https://wwwn.cdc.gov/NHISDataQueryTool/SHS_adult/index.html
These resources outline key mental and physical health factors that affect residents of Michigan.
This dataset provides information regarding the percentage of people living in poverty within the Western Upper Peninsula of Michigan.
This dataset describes the highest level of education achieved by people in the Western Upper Peninsula.
